1865 Italian general election
 | |||||||||||||||||
All 443 seats in the Chamber of Deputies 222 seats needed for a majority | |||||||||||||||||
|---|---|---|---|---|---|---|---|---|---|---|---|---|---|---|---|---|---|
| |||||||||||||||||
 Constituencies used for the elections | |||||||||||||||||
| |||||||||||||||||

General elections were held in Italy on 22 October 1865, with a second round of voting on 29 October.[1] It was the second one in the history of Italy.
Electoral campaign
The Historical Right was led by the former Prime Minister of the Kingdom of Sardinia, Alfonso Ferrero La Marmora, a long-time general who fought during the Italian unification.
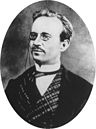
On the other hand, the bloc of the Historical Left was led by Urbano Rattazzi, a liberal politician who was between the founders of the Italian left-wing parliamentary group.
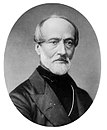
In opposition to the two main blocs there were a third party known as The Extreme, a far-left coalition, under the leadership of Giuseppe Mazzini, an Italian revolutionary and a key figure of the Unification.
On 22 and 29 October only 504,263 men of a total population of around 23 million were entitled to vote.[2] Right-wing candidates emerged as the largest bloc in Parliament with around 41% of the 443 seats.[3] They were largely aristocrats representing rentiers from the north of the country, and held moderate political views including loyalty to the crown and low government spending;[4] the general La Marmora was appointed Prime Minister by the king Victor Emmanuel II.
Parties and leaders
| Party | Ideology | Leader | |
|---|---|---|---|
| Historical Right | Conservatism | Alfonso Ferrero La Marmora | |
| Historical Left | Liberalism | Urbano Rattazzi | |
| Historical Far Left | Radicalism | Giuseppe Mazzini | |
Results
| Party | Votes | % | % of seats | |
|---|---|---|---|---|
| Historical Right | 41.2 | |||
| Historical Left | 35.2 | |||
| Historical Far Left | 3.5 | |||
| Others | 20.1 | |||
| Total | 100 | |||
| Valid votes | 259,035 | 95.26 | ||
| Invalid/blank votes | 12,888 | 4.74 | ||
| Total votes | 271,923 | 100.00 | ||
| Registered voters/turnout | 504,263 | 53.92 | ||
| Source: Nohlen & Stöver | ||||
References
- ^ Dieter Nohlen & Philip Stöver (2010) Elections in Europe: A data handbook, p1047 ISBN 978-3-8329-5609-7
- ^ Nohlen & Stöver, p1049
- ^ Nohlen & Stöver, p1082
- ^ Nohlen & Stöver, p1028
- v
- t
- e

- 1947
- 1949
- 1951
- 1953
- 1954
- 1955
- 1957
- 1959
- 1961
- 1963
- 1964
- 1965
- 1967
- 1968
- 1969
- 1970
- 1971
- 1973
- 1974
- 1975
- 1976
- 1978
- 1979
- 1980
- 1981
- 1983
- 1984
- 1985
- 1986
- 1988
- 1989
- 1990
- 1991
- 1993
- 1994
- 1995
- 1996
- 1998
- 1999
- 2000
- 2001
- 2003
- 2004
- 2005
- 2006
- 2008
- 2009
- 2010
- 2011
- 2012
- 2013
- 2014
- 2015
- 2017
- 2018
- 2019
- 2020
- 2021
- 2022
- 2023
- 2024
- 1946
- 1947
- 1948
- 1949
- 1951
- 1952
- 1953
- 1956
- 1957
- 1958
- 1959
- 1960
- 1961
- 1962
- 1964
- 1965
- 1966
- 1967
- 1968
- 1969
- 1970
- 1971
- 1972
- 1973
- 1974
- 1975
- 1976
- 1977
- 1978
- 1979
- 1980
- 1981
- 1982
- 1983
- 1984
- 1985
- 1986
- 1987
- 1988
- 1989
- 1990
- 1991
- 1992
- 1993
- 1994
- 1995
- 1996
- 1997
- 1998
- 1999
- 2000
- 2001
- 2002
- 2003
- 2004
- 2005
- 2006
- 2007
- 2008
- 2009
- 2010
- 2011
- 2012
- 2013
- 2014
- 2015
- 2016
- 2017
- 2018
- 2019
- 2020
- 2021
- 2022
- 2023
- 2024
- See also: Elections in Abruzzo
- Aosta Valley
- Apulia
- Basilicata
- Calabria
- Campania
- Emilia-Romagna
- Friuli-Venezia Giulia
- Lazio
- Liguria
- Lombardy
- Marche
- Molise
- Piedmont
- Sardinia
- Sicily
- Trentino-Alto Adige/Südtirol
- Tuscany
- Umbria
- Veneto


